Andrii Yalanskyi // Shutterstock
The demand illusion: Why home prices are falling in these 9 growing US cities
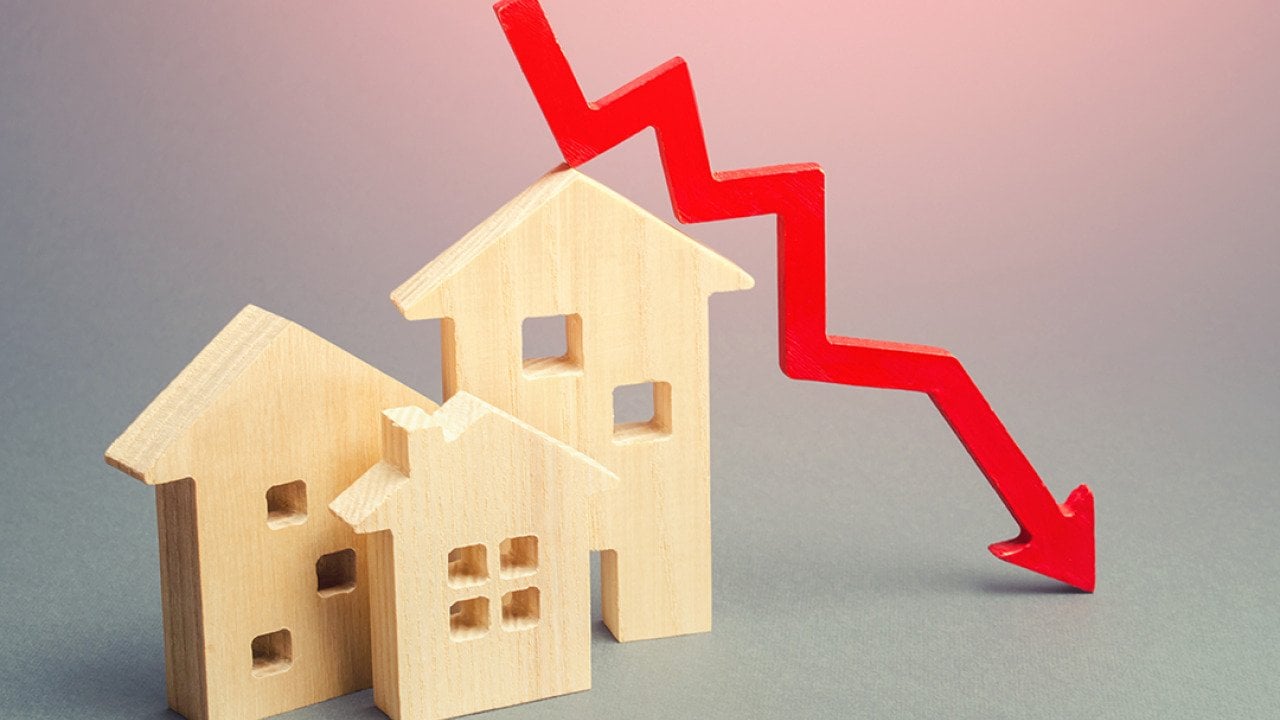
In a normal housing cycle, âmore people moving inâ should mean âprices go up.â But the post-2022 market has produced a counterintuitive pattern in several large U.S. metros: Prices are sliding even while the headcount grows.
This isnât magicâitâs a math problem. When supply rises faster than effective demand, or when buyers canât (or wonât) pay yesterdayâs prices because financing, insurance, taxes, or job growth changed, prices can fall even with population inflows. House of Leon looks at whatâs behind home prices declining in nine cities experiencing growth in the U.S.
The metros where this paradox is most visible right now
Zillowâs Home Value Index (ZHVI) shows the largest year-over-year declines in home values (as of Oct. 31, 2025) concentrated in the Sun Belt and a few big âpandemic boomâ marketsâexactly where population growth has also been strongest.
Meanwhile, the U.S. Census Bureauâs metro estimates show these same metros posted large numeric population gains between July 1, 2023, and July 1, 2024.
Below is the cleanest overlap between âprices dropping fastestâ and âpopulation rising,â according to Zillow data:
- Austin-Round RockâSan Marcos, Texas: home values down about -6.1% YoY (ZHVI); population +58,019
- Tampa-St. Petersburg-Clearwater, Florida: -6.09% YoY; population +50,482
- Miami-Fort Lauderdale-West Palm Beach, Florida: -4.79% YoY; population +123,471
- Orlando-Kissimmee-Sanford, Florida: -4.55% YoY; population +75,969
- Dallas-Fort Worth-Arlington, Texas: -4.02% YoY; population +177,922
- Jacksonville, Florida: -3.40% YoY; population +37,350
- Phoenix-Mesa-Chandler, Arizona: -3.36% YoY; population +84,938
- San Antonio-New Braunfels, Texas: -2.97% YoY; population +47,297
- Atlanta-Sandy Springs-Roswell, Georgia: -2.92% YoY; population +75,134
- Denver-Aurora-Centennial, Colorado: -2.92% YoY; population +31,748
The biggest price drops are showing up in places that built (or listed) more homes into higher-rate demand.
Whatâs actually causing prices to fall while more people arrive?
1. Supply finally showed upâlate, but forcefully
Many of these metros were construction leaders during the boom. New supply arrives with a lag: permitting decisions made in 2021-2022 can translate into completions and competition in 2024-2025. When listings rise, sellers lose leverage, and price cuts spreadâespecially in markets where buyers have lots of near-substitutes (new subdivisions, new multifamily, investor inventory).
Austin is the poster child for this dynamic: Its boom was extreme, its pipeline was heavy, and its repricing has been unusually sharp (Zillowâs metro data and Austinâs own ZHVI page both show meaningful declines into late 2025).
2. Population growth â âbuyer growthâ
This is where most takes go wrong.
Population can increase because of:
- Renters, including international migration and young workers.
- Household consolidation (more roommates, multigenerational living).
- People who move in but delay buying because rates are high.
Census explicitly notes that recent metro growth has been boosted by net international migration and improving natural increase, even as domestic migration patterns remain mixed. That kind of growth supports occupancy and rents more immediately than it supports purchase pricesâespecially at 6%-8% mortgage rates.
3. The affordability ceiling is realâand rates lowered it
In 2020â2021, cheap money let buyers stretch. In 2024-2025, many households simply canât qualify for the same payment, so sellers have to meet the market. That adjustment can happen even if more people want to live there.
4. Sun Belt carry costs are rising (insurance, taxes, HOA, utilities)
In Florida metros in particular, nonmortgage carrying costs (insurance and taxes) can change the affordability equation even if the sticker price looks down only a few percent. The marginal buyer may step back, turning in-migration into rent first.
5. Investor demand cooled, and some inventory came back
A meaningful share of Sun Belt demand in 2021-2022 was investor-driven (single-family rentals, short-term rentals, second homes). When yields compress and financing costs rise, investors stop being price-insensitive biddersâand sometimes become net sellers. Thatâs another way prices can fall while the metro keeps growing.
Why these metros, specifically?
A pattern jumps out from the overlap list:
- Pandemic-era âwinnerâ markets (Austin, Phoenix, Tampa/Orlando/Jacksonville, Dallas) saw the biggest run-ups, which left the most room to mean-revert.
- They also experienced large population gains in the latest Census metro estimates (Table 2âs top numeric gainers).
- Zillowâs biggest price declines cluster in those same metros.
That combination is exactly what youâd expect when a market goes from shortage: A building surge leads to higher-rate normalization.
How to interpret this (so you donât fool yourself)
A falling price in a growing city is not automatically a âdeal.â It can be:
- A healthy normalization after a bubble-ish run-up.
- A sign of oversupply in certain submarkets (new-build outskirts vs. established neighborhoods).
- A signal that âgrowthâ is arriving as renters, not buyers.
The practical move is to treat each metro as a set of micromarkets:
- If youâre investing: Focus on rent growth, concessions, and absorption, not just headline population.
- If youâre buying to live: Falling prices in a growing metro can be a rare windowâbut only if taxes, insurance and job stability pencil out.
This story was produced by House of Leon and reviewed and distributed by Stacker.
![]()

